Last time I have promised you to take a look at more real life scenario regarding threads. In the last blog entry I have shown that on modern operating system and JVM it’s not a problem to create 32,000 threads. Now I want to test how many threads can be handled by a Tomcat instance.
I just want to remind you the motivation. Some people believe that threads are expensive, that we should not create lot of them. They believe that it’s better to use different mechanisms like asynchronous servlets, specialized libraries etc. I just want to find out if we really need such measures or if good old threads are good enough.
If you read articles about asynchronous servlets, you find out that the main motivation is AJAX. Mainly the scenario, when a HTTP connection is open for a long time and the data are sent when an event occurs.
OK, let’s simulate it. We need to simulate lot of open HTTP connections waiting for an event. The easiest way to achieve it is my precious suicidal servlet.
public class ThreadsServlet extends HttpServlet {
	private static final long serialVersionUID = 7770323867448369047L;

	@Override
	protected void doGet(HttpServletRequest req, HttpServletResponse resp) throws ServletException, IOException {
		int number = Integer.valueOf(req.getParameter("number"));
		try {
			System.out.println("Servlet no. "+number+" called.");
			URL url = new URL(req.getScheme()+"://"+req.getServerName()+":"+req.getServerPort()+req.getRequestURI()+"?number="+(number+1));
			Object content = url.getContent();
			resp.setContentType("plain/text");
			resp.getWriter().write("OK: "+content);
		} catch (Throwable e) {
			String message = "Reached "+number+" of connections";
			System.out.println(message);
			System.out.println(e);
			resp.getWriter().write(message);
		}
	}
}
The servlet is quite simple, it just opens HTTP connection to itself. So it basically tries to create infinite number of connections. Top keep track of the progress, there is a request parameter “number” that is incremented with each call. We can thus observe how many active connections we have.
Default configuration
Let’s run it. Just open “http://localhost:8080/threads/something?number=1” in your browser and see what happens.
Not much, in console (or logs/catalina.out) you can see
...
Servlet no. 37 called.
Servlet no. 38 called.
Servlet no. 39 called.
Servlet no. 40 called.
What? Only 40 concurrent threads served? That’s not much. Let’s try better.
Connector configuration
We can reconfigure Tomcat connector to be able to serve more connections (server.xml)
    <Connector port="8080" protocol="HTTP/1.1"
               connectionTimeout="20000"
               redirectPort="8443"
               maxThreads="32000"/>
As we know from the last time, 32K is the OS limit, we can’t go over that. If we execute the test, the results are slightly better:
Servlet no. 485 called.
Servlet no. 486 called.
Servlet no. 487 called.
Servlet no. 488 called.
Servlet no. 489 called.
Servlet no. 490 called.
May 1, 2010 5:55:32 PM org.apache.tomcat.util.net.JIoEndpoint$Acceptor run
SEVERE: Socket accept failed
java.net.SocketException: Too many open files
        at java.net.PlainSocketImpl.socketAccept(Native Method)
        at java.net.AbstractPlainSocketImpl.accept(AbstractPlainSocketImpl.java:358)
        at java.net.ServerSocket.implAccept(ServerSocket.java:470)
        at java.net.ServerSocket.accept(ServerSocket.java:438)
        at org.apache.tomcat.util.net.DefaultServerSocketFactory.acceptSocket(DefaultServerSocketFactory.java:61)
        at org.apache.tomcat.util.net.JIoEndpoint$Acceptor.run(JIoEndpoint.java:310)
        at java.lang.Thread.run(Thread.java:636)
Wow, it looks like, that there is some limit on open files. Since I am not Linux guru, the first thing I have tried was to change Tomcat connector to nonblocking.
Nonblocking Connector
To use nonblocking connector, you have to set the protocol in server.xml
  <Connector port="8080"
               connectionTimeout="20000"
               redirectPort="8443"
		protocol="org.apache.coyote.http11.Http11NioProtocol"
		maxThreads="32000"/>
Unfortunately the result is almost the same:
Servlet no. 483 called.
Servlet no. 484 called.
Servlet no. 485 called.
Servlet no. 486 called.
May 1, 2010 5:59:24 PM org.apache.tomcat.util.net.NioEndpoint$Acceptor run
SEVERE: Socket accept failed
java.io.IOException: Too many open files
        at sun.nio.ch.ServerSocketChannelImpl.accept0(Native Method)
        at sun.nio.ch.ServerSocketChannelImpl.accept(ServerSocketChannelImpl.java:163)
        at org.apache.tomcat.util.net.NioEndpoint$Acceptor.run(NioEndpoint.java:1198)
        at java.lang.Thread.run(Thread.java:636)
Increase Open File Limit
Apparently, the blocking connector was not the issue. After some time spent with Google I have found the answer. Linux is limiting number of open connections. You can execute “ulimit -n” to see what’s your limit. Luckily, it’s possible to change the limit. You can either set it by “ulimit -n 32768” if you have permissions or by adding following lines to /etc/security/limits.conf (lukas is my username)
lukas            hard    nofile          32768
lukas            soft    nofile          32768
To apply this change you have to logout and login. After that, you will see this:
Servlet no. 5856 called.
Servlet no. 5857 called.
Servlet no. 5858 called.
Servlet no. 5859 called.
May 1, 2010 6:07:58 PM org.apache.tomcat.util.net.NioEndpoint$SocketProcessor run
SEVERE:
java.lang.OutOfMemoryError: GC overhead limit exceeded
	at java.util.Arrays.copyOf(Arrays.java:2894)
	at java.lang.AbstractStringBuilder.expandCapacity(AbstractStringBuilder.java:117)
	at java.lang.AbstractStringBuilder.append(AbstractStringBuilder.java:407)
	at java.lang.StringBuilder.append(StringBuilder.java:136)
	at java.lang.StringBuilder.append(StringBuilder.java:132)
	at java.lang.Throwable.printStackTrace(Throwable.java:529)
	at java.util.logging.SimpleFormatter.format(SimpleFormatter.java:94)
	at java.util.logging.StreamHandler.publish(StreamHandler.java:196)
	at java.util.logging.ConsoleHandler.publish(ConsoleHandler.java:105)
	at java.util.logging.Logger.log(Logger.java:476)
	at java.util.logging.Logger.doLog(Logger.java:498)
	at java.util.logging.Logger.logp(Logger.java:698)
	at org.apache.juli.logging.DirectJDKLog.log(DirectJDKLog.java:167)
	at org.apache.juli.logging.DirectJDKLog.error(DirectJDKLog.java:135)
	at org.apache.coyote.http11.Http11NioProtocol$Http11ConnectionHandler.process(Http11NioProtocol.java:755)
	at org.apache.tomcat.util.net.NioEndpoint$SocketProcessor.run(NioEndpoint.java:2080)
	at java.util.concurrent.ThreadPoolExecutor.runWorker(ThreadPoolExecutor.java:1110)
	at java.util.concurrent.ThreadPoolExecutor$Worker.run(ThreadPoolExecutor.java:603)
	at java.lang.Thread.run(Thread.java:636)
We have reached 5856 threads before we run out of memory. Cool.
Increase Heap Size
Let’s try to increase the heap size. Just add “-Xmx2048m” to JAVA_OPTS. Before I have started running out of heap, I got to cca 11000 threads! Is it enough? I do not know, but I think it’s pretty good.
Moreover, if you do a heap dump, you will see, that most of the memory is consumed by char and byte arrays. (This heap dump has been taken with approximately 5000 connections, screenshot from VisualVM)
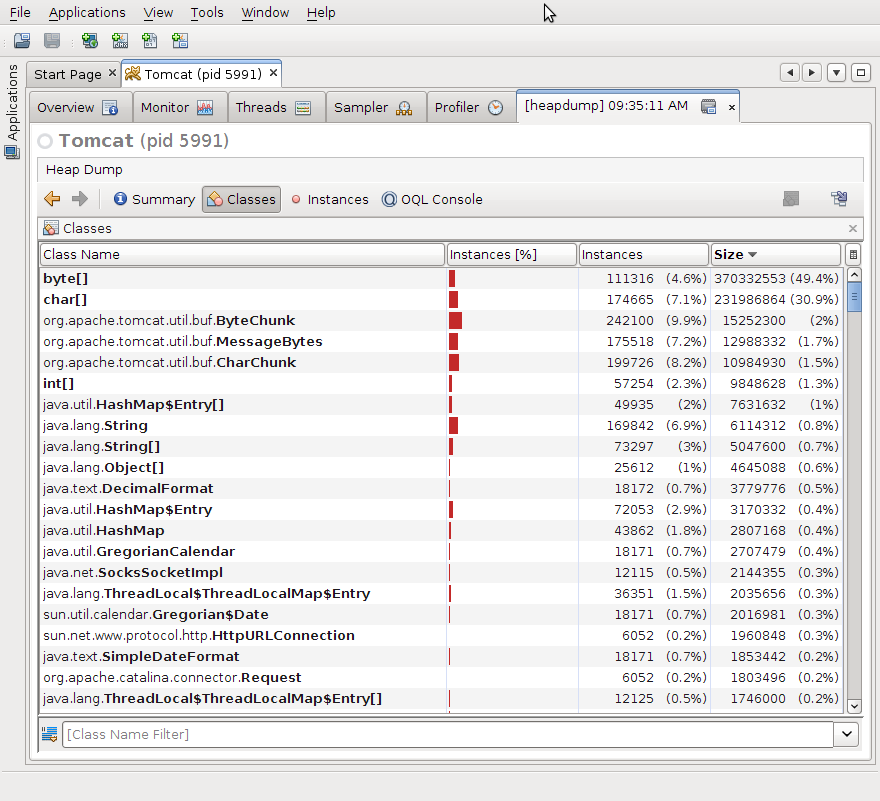
It’s understandable, we have lot of open buffers on both sides. I assume that we have at least four buffers per servlet. One for sevlet request, one for servlet response, one for URL request and one for URL response. But maybe there will be other buffers as well. To be honest, I have to admit that memory consumed by stacks would not appear here, it’s probably handled by OS. But we have run out of the heap, so that’s why I am talking about it.
Smaller buffers
We can try to make some of the buffers smaller. I was able to find only one setting that had some effect. Again it is connector setting in server.xml config file.
  <Connector port="8080"
               connectionTimeout="200000"
               redirectPort="8443"
		protocol="org.apache.coyote.http11.Http11NioProtocol"
		maxThreads="32000"
		socket.appReadBufSize="1024"
		socket.appWriteBufSize="1024"
		bufferSize="1024"/>
With this setting, I was able to get near to 13000 open connections.
...
Servlet no. 13327 called.
Servlet no. 13328 called.
Servlet no. 13329 called.
Servlet no. 13330 called.
Servlet no. 13331 called.
Servlet no. 13332 called.
After that the machine started to run out of physical memory, GC took ages so I had to stop the server. (Just to remind you, my test machine is two year old laptop with Intel Core 2 Duo T8100 2.1GHz with 4GB of RAM. There is 64bit Linux 2.6.32 and OpenJDK (IcedTea6 1.8) running on top of it.)
As we have seen, threads are not the major issue on modern machines. There is probably significant amout of memory consumed by the stack traces too, but I think the biggest problem are the buffers. And the important point is, that we would need the buffers even if we used asynchronous servlets! Of course, there is still some overhead connected with threads, so asynchronous libraries have their place. In fact, it would be nice to try similar experiment with asynchronous servlets. I am afraid, that I will not be able to do it, but I will be glad to help if there is some volunteer.
Please also note that your numbers may vary. After all this has been quite artificial test. I think it’s simulates lot of real-life use cases, but you know, the reality is always different.
On the other hand, with more physical memory and better Tomcat configuration, we might got to higher numbers. I have heard legends about 16K threads.
I think that I will finish with my favorite message. Do not use complicated constructs unless you are sure you need them. Please remember golden rules of optimization:
The First Rule of Program Optimization: Don’t do it.
The Second Rule of Program Optimization (for experts only!): Don’t do it yet.
If you want to verify my results, the source code is here. If you have some comments, different results or advices, do not hesitate to add a comment.
Resources:
Tomcat connector config
Why we need asynchronous servlets
Note: If you wonder why the hell I have started to write in something that looks almost like English when apparently I do even more mistakes than in Czech, the answer is simple. I just need to practice my English (apart from that I want to be world famous, not just known in Czech Republic)
